Having now written all I know about IQ in families, I turn to IQ in groups. It is rare that a social conversation will cover the IQ of individual families, but the IQ of groups is often a hot topic in discussions of the economy or of politics.
Measuring and writing about the IQ of groups of people, and the role that heredity plays, is controversial, even taboo — particularly if the groups test less well. If you don’t wish to know about this subject, you can skip the rest of this site.
I ask you, what is the alternative to this knowledge? If you assume that all groups have equal mental abilities and motivation to succeed, as many people do, then you must conclude, as many do, that our society today is mainly based upon present discrimination. And if you believe this, will you conclude that for justice we must give special treatment to certain groups, including quotas?
The “whys” for the data on groups are open to debate, and while I am confident that you already have, or will form, your own opinion on the relative influence of heredity, psychology, culture, and physical environment, nonetheless I would like to present a few statistics.
Please always remember not to judge individuals by the characteristics, real or imagined, of their group, whether IQ, religion, or whatever. We all want to be judged as individuals, and we should try to judge others, if we judge them at all, the same way.
The evidence of lineages on IQ
The study of lineages goes back to Sir Francis Galton in the mid-19th century. He himself came from a distinguished lineage of industrialists, bankers, authors, politicians and scientists: He was a first cousin of Darwin, his father and other progenitors had made outstanding intellectual and leadership contributions to Great Britain for centuries. Galton speculated that linages existed, but could not amass the data to prove it.
Until recently, scholars believed that social mobility was high, and that lineages did not exist. This has changed because of Gregory Clark’s work, found in his book The Son Also Rises, published by Princeton University in 2014. (Source 1) Using rare names that were exclusive either to the elite or to the lower class – names that can be traced over many, many generations either in tax rolls and elite university admissions (such as to Oxford and Cambridge) – or not in them – and looking at data (usually only available for males) from medieval and modern England, Sweden, the United States, India, China, Japan, Korea and Chile, Clark finds that “class” persists from generation to generation by a factor of approximately 80%.
Thus if a certain name is associated with high income and elite education, the name, over many generations, it will slowly be less present until it reaches the population average; and to the contrary, if the name is never found in tax rolls or elite universities, heirs, over many generations, it will slowly ascend to average inclusion. These movements towards the mean are due to marriages with individuals who are closer to the mean. (Some very rare lineages, with exclusive in-marriage, maintain their high social position over centuries.). (With the increase of assortative marriage, this is now more likely to be the case.)
Previous studies of social mobility have only looked at the two generations, and these have shown much higher mobility. Clark demonstrates that these one-generation fluctuations do not change the underlying trend of the lineage. More likely than not, the third and fourth generations will return to, or exceed, the trend line.
Is heredity the cause? Clark writes that he cannot prove heredity is the cause of his findings, but, on the other hand, he states that his findings are completely consistent with a hereditary explanation. Moreover, other explanations he examines, such as the inheritance of wealth among the upper class, were valid only for the extremely wealthy – not for those of average wealth that made up the bulk of his samples.
Is inherited intelligence the cause of social position lineages? Clark does not discuss what hereditary factors might be responsible for his data. However, given the high heritability of adult intelligence in families, and the much lower heritability of emotions and traits (such as conscientiousness and extraversion), a maximum of about 35% – 50% (Source Is heredity the cause? Clark writes that he cannot prove heredity is the cause of his findings, but, on the other hand, he states that his findings are completely consistent with a hereditary explanation. Moreover, other explanations he examines, such as the inheritance of wealth among the upper class, were valid only for the extremely wealthy – not for those of average wealth that made up the bulk of his samples.2 3), perhaps you will agree with me that intelligence is in a large part responsible for the persistence of academic and financial success in lineages. Clark’s book is full of interesting data and discussion, and I highly recommend it.
The evidence from Clark’s work, as well as the evidence from other inbred groups such as Ashkenazim Jews then, is that chance effects in heredity and from other causes, average out over several generations, leaving heredity (and changing culture and environment) as the influences.
IQs in Nations
Who is to say that IQ tests given in various countries are fair or comparable? Who is to say, in third world countries, whether the citizens are familiar with the kind of abstract problems that many of the tests use? Who is to say that the test-takers have ever taken tests before? Who is to say that they are free of disease, or that they are not intimidated by the test procedures?
Beyond these questions, the international IQ data compiled by Richard Lynn and Tatu Vanhanen is now 30 to 40 years old, although they were adjusted to lessen errors in 2002 and 2006. (Sources 4 5) So, without a doubt, the test results of many less developed nations are open to question, and would be higher than when they came out. According to the second source, all of the various intelligence tests administered internationally come up with similar results. For what it is worth, here is a map of their IQ results:

Sub-Saharan health is far worse than elsewhere (World Health Organization, multiple statistics in Source 6). In addition to the widespread prevalence of tropical diseases and problem pregnancies, anemia and iodine deficiency are common. Health is one of the reasons why sub-Saharan Africa’s IQ test results are low. Another reason may possibly be that black Africa has been the area most isolated from the modern world. Still another reason may be the practice of swaddling babies, which prevents their exploration and restricts exercise. (Source 7)
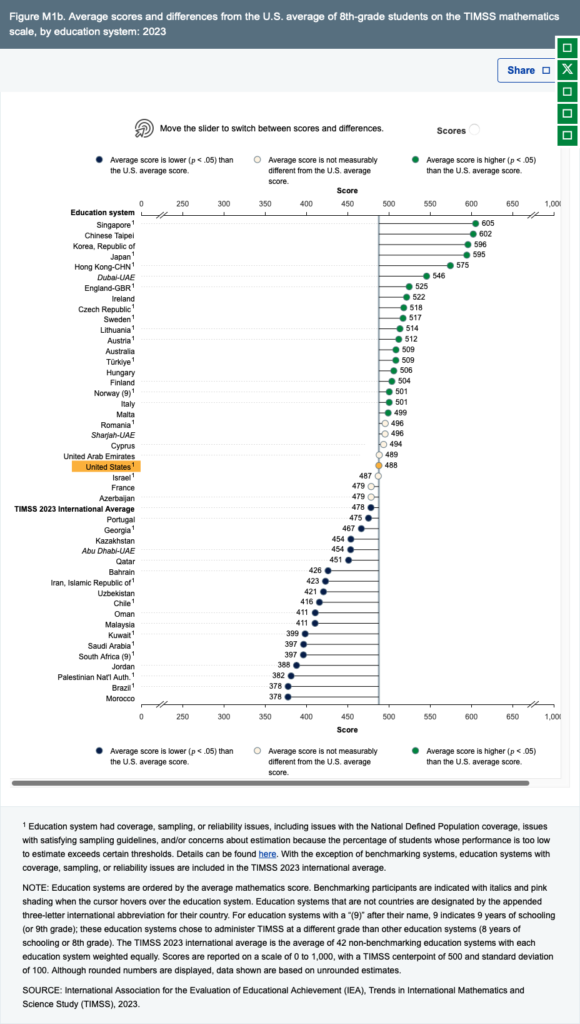
Below, I am including charts from the 2015 TIMSS (Trends in International Mathematics and Science Study) 8th grade Mathematics Achievement distribution (Source 8). https://nces.ed.gov/timss/results23/index.asp#/math/intlcompare), widely recognized as consistent between nations. This study has also been found to be consistent with other school tests of IQ around the world. In each country a minimum of 4,500 students are tested. The data are in many respects consistent with the IQ map.
IQs by Sexes
For a comprehensive discussion of this subject, see Wikipedia (Source 9 and its references). In summary, if there is a difference between males and females in general IQ, it is at most 4 points of IQ in either direction. Studies conflict, but it seems that women may have an advantage in verbal and social IQ, whereas men may be better in spatial IQ and abstract reasoning.
The above diagram shows normal distributions for males (orange line) and females (green line) when their means are identical (and the male to female (variance ratio) = 1.2. The schematic on the right shows a blowup of the distributions in the region from 3.8 to 4.2 standard deviations above the mean. Brown, area of overlap of the 2 distributions; green and orange, areas unique to females and males, respectively
Across many areas of IQ, notably in mathematics, men have a more skewed distribution than women, that is women’s skills are bunched somewhat more around average. The chart above, based upon a 2008 article in the Proceedings of the National Academy of Science (similar to other Internet graphics on this subject), illustrates a a historical pattern. But this pattern is perhaps somewhat less valid today. Presently, in the countries where gender-equality has been the highest, the numbers of 17-year-old women excelling in a high level international mathematics competition exceeded men. The number of women at the highest levels of mathematics has been increasing. (Source 10). Stereotype threat has been shown to diminish women’s performance on science and math tests, but seems to be decreasing.
Whatever the reason for men having a more broad distribution, whether due to an intelligence skew or to cultural influences, historically they have been much more highly represented among mathematical, scientific, and musical geniuses. And, on the other hand, more highly represented among the lowest IQ scores.
IQs: Race and Ethnic Groups
It is striking that almost all ethnic groups arriving in the United States from Europe or Asia since the 1920s when IQ testing began, started out with low IQ test scores, well below the US average, before rising to it or exceeded it. They all did the worst on abstract questions, where many of them now excel.
The IQ of Mexican Americans and Puerto Ricans has been rising, but at a much slower rate than for many previous immigrant groups–perhaps because these groups have been slow to assimilate. Groups that have become culturally isolated tend to have low IQs, even dropping IQs. (Wikipedia, Source 11, very much worth reading, covers the topics of these two paragraphs.)
African-American IQs:
Try, if you wish, to find studies of IQ by race in Europe or Canada! I cannot. In France such statistics are illegal. For Australia there is data for aborigines; for New Zealand, for Maori, but none for blacks. For blacks not living in Africa that leaves data from Great Britain and the USA.
African-Americans, who arrived originally as slaves, have had rising IQs over the years, but these have stalled at about 15 -18 IQ points below those of white Americans. This is called “the black-white IQ test score gap”. (In Great Britain, black IQ test scores are 8 points lower than white test scores.) For a compilation of studies of Test Scores in the United States for whites and blacks, I suggest the the definitive work on this subject, with extraordinary amounts of data: https://reasonwithoutrestraint.com/the-scope-of-racial-disparities-in-test-scores-in-the-united-states. Because of the scope of that site, I am not going to provide data here.
In much of the USA black persons have been treated very badly over the years, and to some degree still are today. It is worth noting that many American states where African Americans lived prevented black GIs from benefiting from the educational and housing benefits of the G.I. Bill after WW II, and that many cities and real estate companies red-lined them into the worst neighborhoods. (Source 12) It is also worth noting that the raw IQ scores of whites in 1945 was comparable to that of blacks today (while that of blacks was much lower). The IQs of both whites and blacks rose, but the IQ of blacks rose faster. Since 1998 IQs of both races have declined slightly (the negative Flynn effect), and, as mentioned above, the gap has remained unchanged. It is well known that very few blacks have only African blood. Most of the people who self-identify as blacks are mixtures of African blood with 20 to 25 percent European blood, and perhaps a bit of American Indian and Hispanic blood. (Source 13) All recent studies of IQ by race use self-identification to classify race.
On an Armed Forces Qualification Test (from about 2004) it should be noted that black women scored several (equivalent to IQ) points higher on tests than did black men (Source 14), though there may have been a difference in the IQs of the women and men who applied.
Black men do not perform as well academically or in the workplace. Black women in the United States, in 2009, acquired 66% of the bachelor’s degrees awarded to African-Americans, 72% of the master’s degrees and 67% of the doctoral degrees (Source 15). Working black women have income parity with white women.Since, in general, the IQ tests results are not all that different for black women and men, the lower levels of intellectual achievement and job success of black men must be due to cultural or inherited attitudes, emotions, or health. Important evidence comes from certain charter and public schools, where average black boys have achieved much higher competency than elsewhere, and from biographies. This suggests that motivation of the students and their parents by extraordinary teachers and administrators be primary. (Sources 16 17)
Why do black boys, and minority children in general, need stronger external motivation than do black girls or white children? There is a significant, but inconclusive academic literature examining these matters. Since this is not a sociological paper, I will not cite and analyze the many studies of this subject. I will simply state, based upon my reading, that there is some evidence that self-stereotyping plays a role, some evidence that parenting techniques play a role, and some evidence that hormone levels play a role.
If great principals and teachers can achieve results, how do we get enough of these where they are needed?
Which cultural or environmental factors might account for the IQ test score gap?
Cultural Influences on IQ:
A cultural influence that certainly is important is the amount of time studying. The data is mixed, but all show that Asians do almost twice the amount of homework of whites and that non-hispanic whites do more than blacks. The study below from The Brookings Institution may provide useful data, since study can definitely raise IQ test results(Source18).

I classify the following as cultural, since it is within the control of families to remedy them, at: More children per family, poorer nutrition, and choice of diet, insufficient iodine, insufficient iron. It is perhaps debatable whether stereotype thread susceptibility is a cultural factor, or an inherited trait.
Environmental Influences on IQ:
These environmental factors may account in part for the black-whiteIQ test score gap: exposure to toxins, such as lead and air pollution, due to living and working in the worst housing and the worst neighborhoods; exposure to chemicals and pesticides due to menial factory or agricultural jobs; less time to discipline or bond with their children due to multiple jobs; more ill health; less exercise; less exposure to brain stimulating activities and abstract tasks; more stress; experiencing discrimination; less time spent in test preparation; ;less motivation to do well on IQ tests.
Each of these factors may account for only a few IQ points, but together they may well account for some, most or all of the entire IQ test score gap.
IQs of Hispanics and Asian-Americans:
The IQ test distribution for Hispanics fall between those of whites and blacks, while the IQ test distributions for Asians is very slightly above that for whites.
Rather than present bell curves, I present the 2015 SAT distributions for mathematics found in a graph from the Brookings Institution (Source 19). It shows the astounding preponderance of Asians at the highest levels and the preponderance of blacks and Latinos at the lowest levels. Brookings estimates that 16,000 whites and 29,570 Asians scored above 750 on the SAT, while only at the very most 1,000 blacks and 2,400 Latino’s did. The distribution of scores on the ACT test were similar.

It is well-known the East Asians place a very high family emphasis on learning, study, and test preparation. According to Julie Park, a researcher at UCLA, the percentage of various groups taking SAT test preparation classes are as follows: Korean-Americans, over 50%; Chinese-Americans, 42%; Blacks, 40.4%; whites 35.6%; Hispanics 32.4% (Source 20). However the type of test preparation varies by group: East Asians, take three-times as many commercial test preparation courses; whereas all groups take private tutoring, often remedial. Private tutoring has little success in raising SATs, whereas the commercial test preparation can raise scores by 10 to 30 SAT points, but only among those who are already well-prepared academically. (Source 21).
A study from Berkeley (Source 22) presents some unsettling data: first, the gap between whites and Blacks/Hispanics in California on the SAT has been increasing from about 160 in 1998 to 190 in 2014. Second, race became ever more important in predicting SAT results throughout the first decade of the 21st century, as illustrated in the following graphic:

The above three factors explained, in the most recent years, about one-third of the variance in SAT scores. Each factor was “standardized” to eliminate the other two.
The Berkley study mentions that high school grades are much greater predictors of success in the University of California system than are SATs, but that blacks and Hispanics are greatly underrepresented among high school students with the best grades.
Family income is not the topic of this article, but it is known to be somewhat correlated with IQ test results. Gaps between white and minority income are comparable to gaps in IQ test results. Hispanics trail whites by 4 percentile points. East Asians earn more than whites on average.
For any group of parents with identical incomes, the income of the children of black and of American Indians lies 13 percentile points below the children of whites. (Source 23). (This data is consistent with regression to the mean, if blacks and Indians truly have lower mean earning ability than whites, whether due to capability, psychology or average environment.) The analysis in this source considers many of the same issues that I discuss in this article.
IQs of Australian Aborigines , Bushmen and so on:
These groups, genetically distinct from other races, test with very low IQs, well under 70. I will not discuss the validity of their IQ tests, nor the reason for the results. It should be noted, however, that their societies have persisted for centuries in their environments, whereas Caucasians of comparable IQ test results might not be able to.
IQs of Ashkenazi Jews:
The average IQ of the Ashkenazi has been found to be 112 to 115. However Ashkenazi spatial IQ may be only about 98. Sephardic and other non-Ashkenazi Jews have average IQs.
The upper tail of the Ashkenazi IQ distribution goes well into the genius category, as is evidenced, for example, by the fact that 27% of the USA Nobel Prize winners have been Ashkenazi Jews, compared to their 2% in the population. Jews (like Asians) may have an affinity for study, which may be a factor in their higher IQ test results and in their achievements.
Scholars dispute the origins of this exceptional IQ. It is clear, however, that Ashkenazi intellectual ability, whether due in part or all to heredity or to culture, has passed from generation to generation (along with a cluster of rare genetic diseases) because, until recently, their marriages were almost exclusively with other Ashkenazi Jews. (Sources 24 25)
To what extent do lower socio-economic status, poorer schools, worse health. less exercise due to neighborhood dangers, stereotype threat, and other effects reflecting years of slavery and discrimination, explain partially or wholly the present-day lower black IQ test results? To what extent is the test gap caused by heredity? I have laid out or referenced all the evidence that I know of. You will have to decide for yourself.
Next page: https://iqscience.net/implications/
- Gregory Clark’The Son Also Rises, Princeton University Press, 2014. ↩︎
- https://static1.squarespace.com/static/5a372ca9f9a61ed6e86178a7/t/5c22ed70032be4789680f2ef/1545792883473/Heritability+of+the+Big+Five+Personality+Dimensions+and+Their+Facets+-+A+Twin+Study.pdf Jang & Livesley, 1996 ↩︎
- https://www.ncbi.nlm.nih.gov/pubmed/28406678 Genetic and environmental influences on emotion regulation: A twin study of cognitive reappraisal and expressive suppression. McRae K1, Rhee SH2, Gatt JM3, Godinez D1, Williams LM4, Gross JJ5., Emotion 2017 ↩︎
- IQ and Global Inequality, Richard Lynn, Tatu Vanhanen, Washington Summit Publishers, 2006 ↩︎
- http://emilkirkegaard.dk/en/wp-content/uploads/The-g-factor-of-international-cognitive-ability-comparisons-the-homogeneity-of-results-in-PISA-TIMSS-PIRLS-and-IQ-tests-across-nations.pdf ↩︎
- https://www.who.int/gho/publications/world_health_statistics/2018/en/ ↩︎
- Personal observation based upon travels in several African countries ↩︎
- http://timss2015.org/timss-2015/mathematics/student-achievement/ ↩︎
- https://en.wikipedia.org/wiki/Sex_differences_in_intelligence ↩︎
- https://www.ncbi.nlm.nih.gov/pmc/articles/PMC2689999/ Gender, culture, and mathematics performance, Janet S. Hydea and Janet E. Mertz ↩︎
- https://en.wikipedia.org/wiki/Race_and_intelligence ↩︎
- https://www.history.com/news/gi-bill-black-wwii-veterans-benefits Erin Blakemore, How the GI Bill’s Promise Was Denied to a Million Black WWII Veterans ↩︎
- https://www.theroot.com/exactly-how-black-is-black-america-1790895185 ↩︎
- http://helmuthnyborg.dk/wp-content/uploads/2016/10/Publ_2015_Sex-differences-across-diffferent-racial-ability-levels.pdf ↩︎
- U.S. Dept. of Education, 2012 ↩︎
- https://www.nps.k12.nj.us/press-releases/newark-public-schools-parcc-results-show-continued-progress/ ↩︎
- Book: The education of Eva Moskowitz, a Memoir, Eva Moskowitz, Harper-Collins, 2017, documents the success of a group of charter schools open to all in New York City ↩︎
- https://www.brookings.edu/articles/analyzing-the-homework-gap-among-high-school-students/ ↩︎
- https://www.brookings.edu/research/race-gaps-in-sat-scores-highlight-inequality-and-hinder-upward-mobility ↩︎
- https://www.studyinternational.com/news/asian-americans-test-scores-sat-act/ ↩︎
- https://journals.sagepub.com/doi/10.1177/0038040711417009 The Academic Success of East Asian American Youth: The Role of Shadow Education, Soo-yong Byun, Hyunjoon Park ↩︎
- https://cshe.berkeley.edu/sites/default/files/publications/rops.cshe_.10.15.geiser.racesat.10.26.2015.pdf Saul Geiser, The Growing Correlation Between Race and SAT Scores: New Findings from California, 2015 ↩︎
- http://www.equality-of-opportunity.org/assets/documents/race_paper.pdf Race and Economic Opportunity in the United States: An Intergenerational Perspective, Raj Chetty and al ↩︎
- https://en.wikipedia.org/wiki/Ashkenazi_Jewish_intelligence ↩︎
- https://web.mit.edu/fustflum/documents/papers/AshkenaziIQ.jbiosocsci.pdf Cocran et al., Natural Historyof Ashkenai Intelligence ↩︎